> ## Documentation Index
> Fetch the complete documentation index at: https://docs.krait.io/llms.txt
> Use this file to discover all available pages before exploring further.
# Call Graph Generation
> Understand how Krait generates call graphs to analyze API endpoints and trace execution paths
## Overview
Krait analyzes each API endpoint by generating a **call graph** that shows a hierarchical representation of your codebase. The call graph provides function invocation relationships for the endpoint, depicting cross-file interactions.
## How it works
Krait builds the call graph through the following process:
1. **Identifies the endpoint's controller** and traces its execution path
2. **Creates structured nodes** representing key elements such as routes, controllers, functions, middleware, and HTTP status codes
3. **Defines parent-child relationships** between these nodes to reflect how each component is invoked
4. **Stores the full structure** in a Memgraph database for querying and visualization
## Node relationships
Krait performs a depth-first search (DFS) starting from the controller function, using **LSP** and **Tree-Sitter** to map out the relationships between nodes:
Connected by `ROUTED_BY` relationship
Connected by `HAS_MIDDLEWARE` relationship
Connected by `CALLS` relationship
Connected by `EMITS` relationship
## Visualization
The call graph provides a complete picture of how data and logic flow through your application, enabling precise security analysis and dependency tracking.
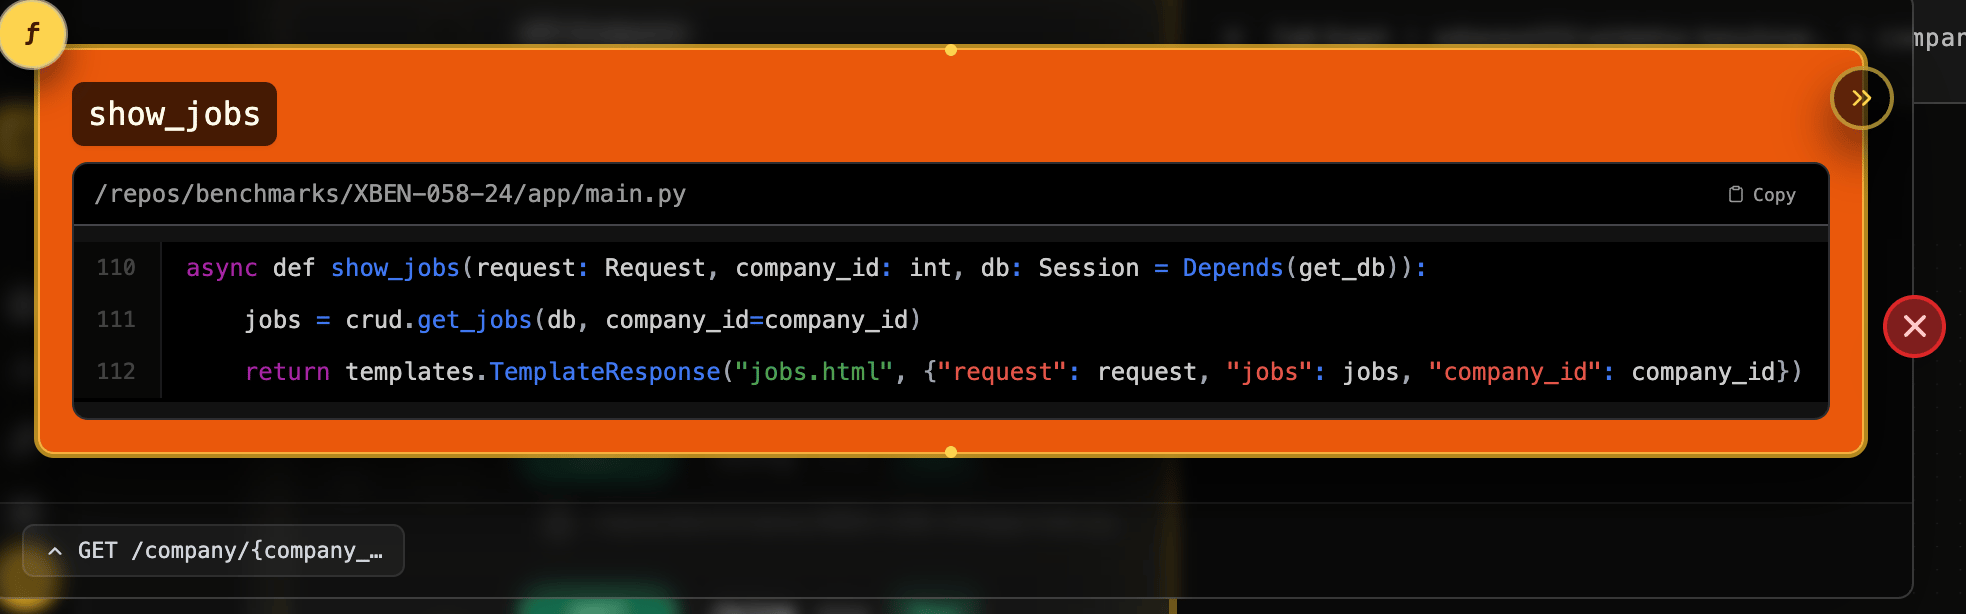
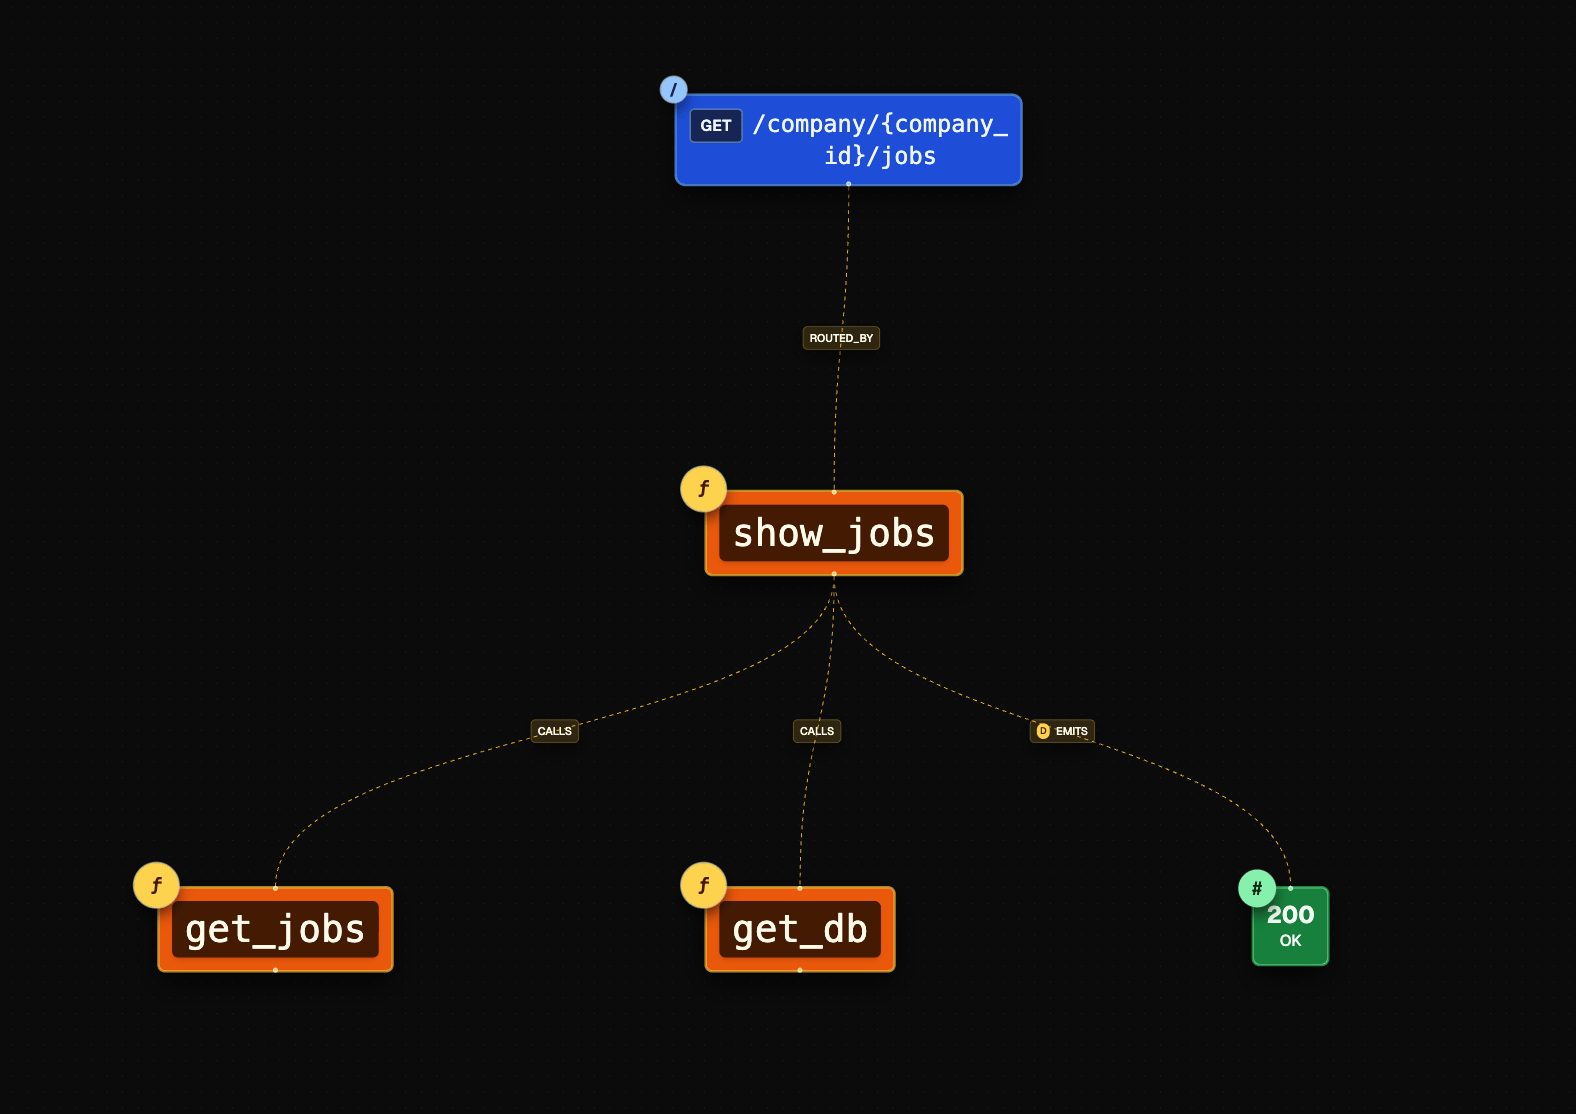 By clicking on any node in the graph, you can view the function definition behind it, giving you immediate access to the exact code responsible for that part of the execution path.
 The call graph is generated automatically as soon as your code repository is integrated, with no additional manual steps required.