Route Vulnerability Detection
At the top of the dashboard, Krait continuously monitors your connected repositories for the most critical API vulnerability classes. Each card represents a category and shows the current detection count across all routes and repos.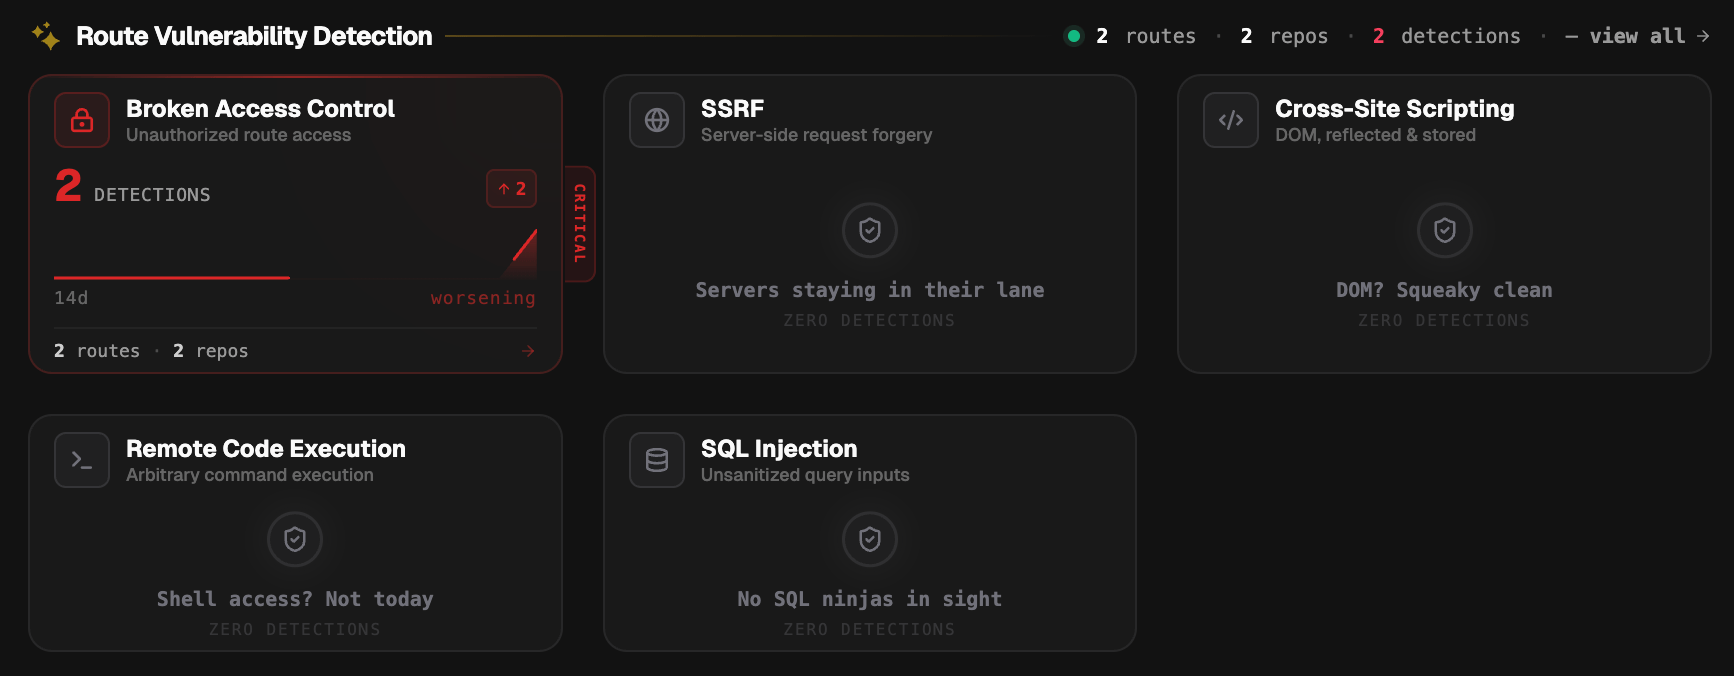
- Broken Access Control - unauthorized route access
- SSRF - server-side request forgery
- Cross-Site Scripting - DOM, reflected, and stored
- Remote Code Execution - arbitrary command execution
- SQL Injection - unsanitized query inputs
Security Posture
The Security Posture widget on the right side of the dashboard gives you a live score from 0 to 100 representing the current health of your workspace.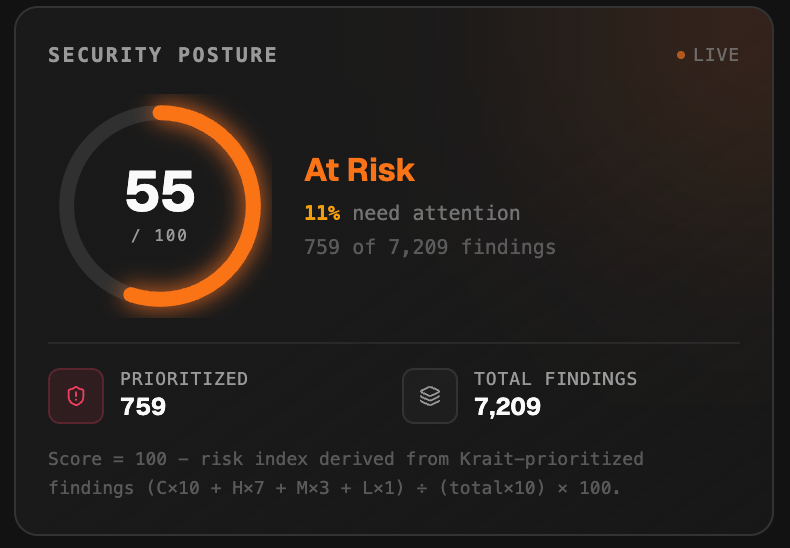
Krait Priority Focus
Below the posture score, Krait Priority Focus shows an AI-curated subset of your total findings. Rather than showing every finding, Krait selects the ones that represent genuine, exploitable risk and surfaces them here. This section shows:- How many findings need your attention out of the total workspace findings
- The percentage of total findings that are prioritized
- How many findings have been filtered out as lower priority
Tasks
The Tasks section lists every security action item currently requiring attention across your workspace. All tasks appear in a single feed so teams can triage, scan, and act from one place.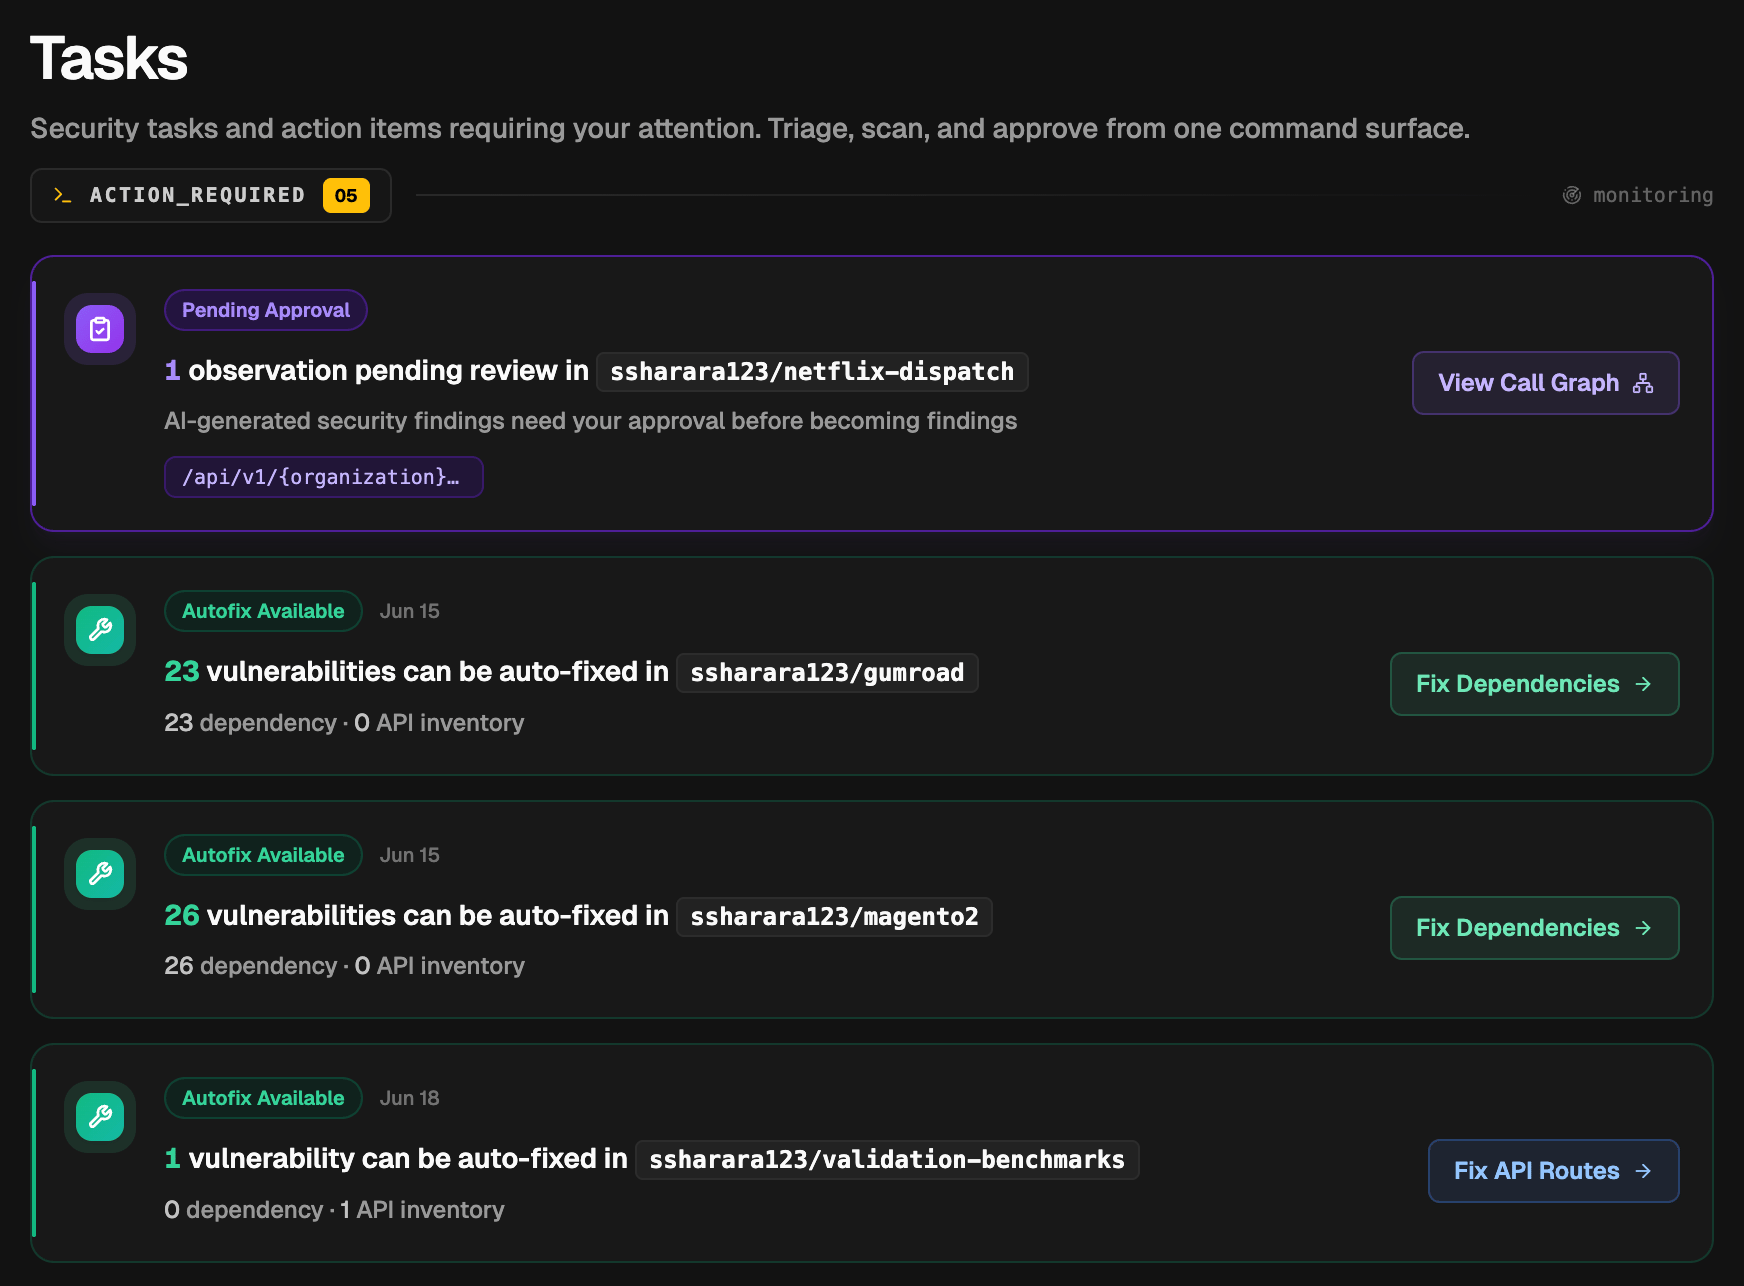
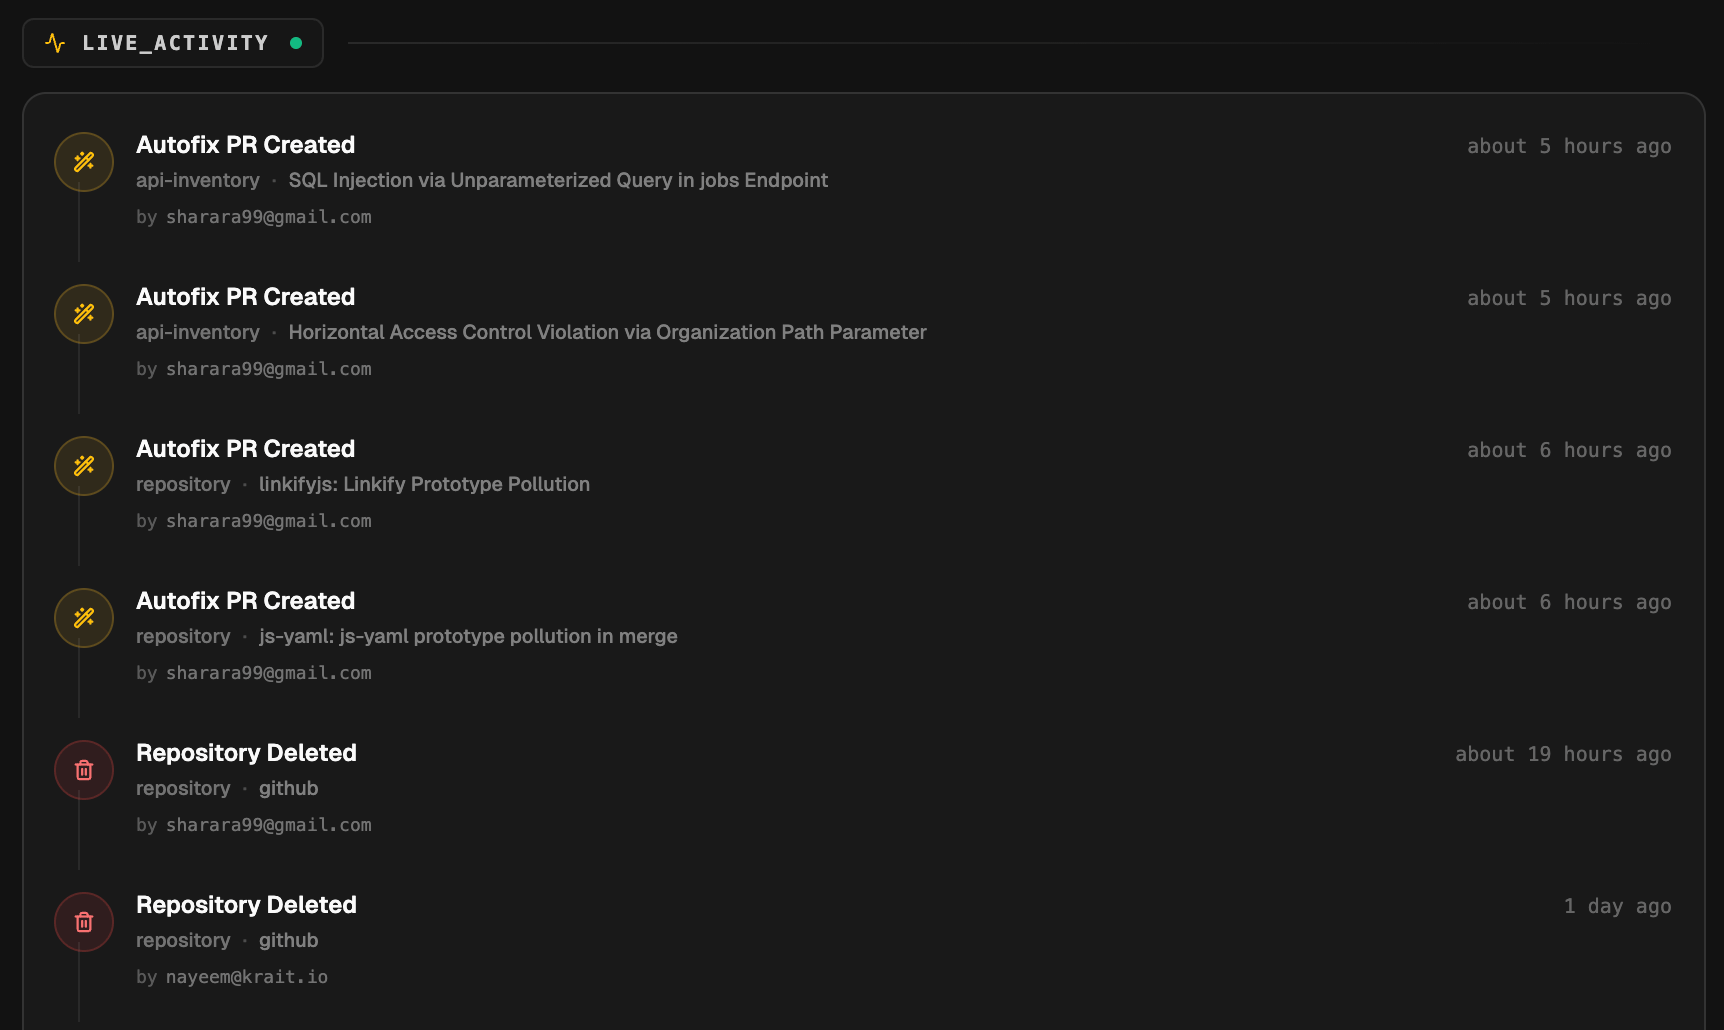
Live Activity
The Live Activity feed shows a real-time log of events happening across your workspace. This includes:- Autofix PR Created - a fix pull request was opened for a repository or API inventory finding, showing the vulnerability name and the user who triggered it
- Repository Deleted - a connected repository was removed
- Autofix Connected - the GitHub or GitLab AutoFix app was installed
Severity Distribution
The Severity Distribution panel shows a breakdown of all findings across your workspace by severity level: Critical, High, Mid, and Low. Each level displays the count and its share of the total.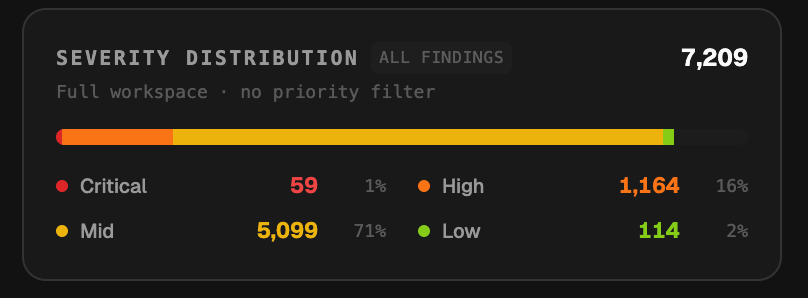
Top Vulnerable Packages
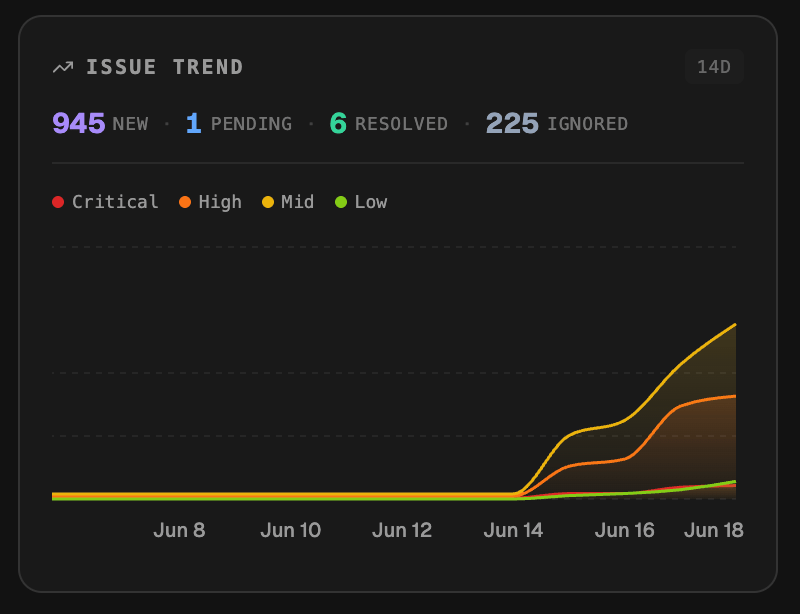
Krait identifies the five packages responsible for the highest number of findings across all connected repositories. Each entry shows the package name, pinned version, and total finding count. This helps teams quickly identify which dependencies are driving the most risk and prioritize upgrades accordingly.Issue Trend
The Issue Trend chart tracks how findings have evolved over the selected time window. It shows counts for:- New - findings detected during the period
- Pending - findings awaiting review or action
- Resolved - findings that have been fixed or closed
- Ignored - findings that have been dismissed
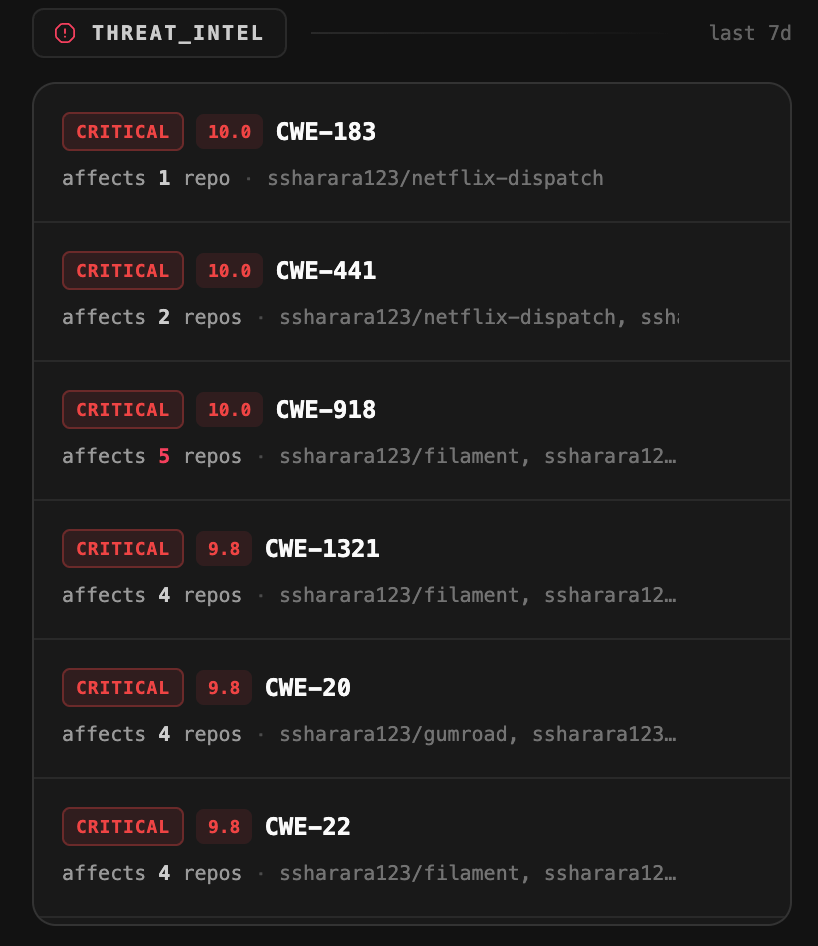
Threat Intel
The Threat Intel panel surfaces CVE and CWE intelligence relevant to your connected repositories, updated on a rolling 7-day window. Each entry shows:- Severity and CVSS score
- CWE identifier
- How many of your repositories are affected
- Which specific repositories are impacted
Repository Risk Matrix
At the bottom of the dashboard, the Repository Risk Matrix gives you a side-by-side comparison of every connected repository ranked by vulnerability count.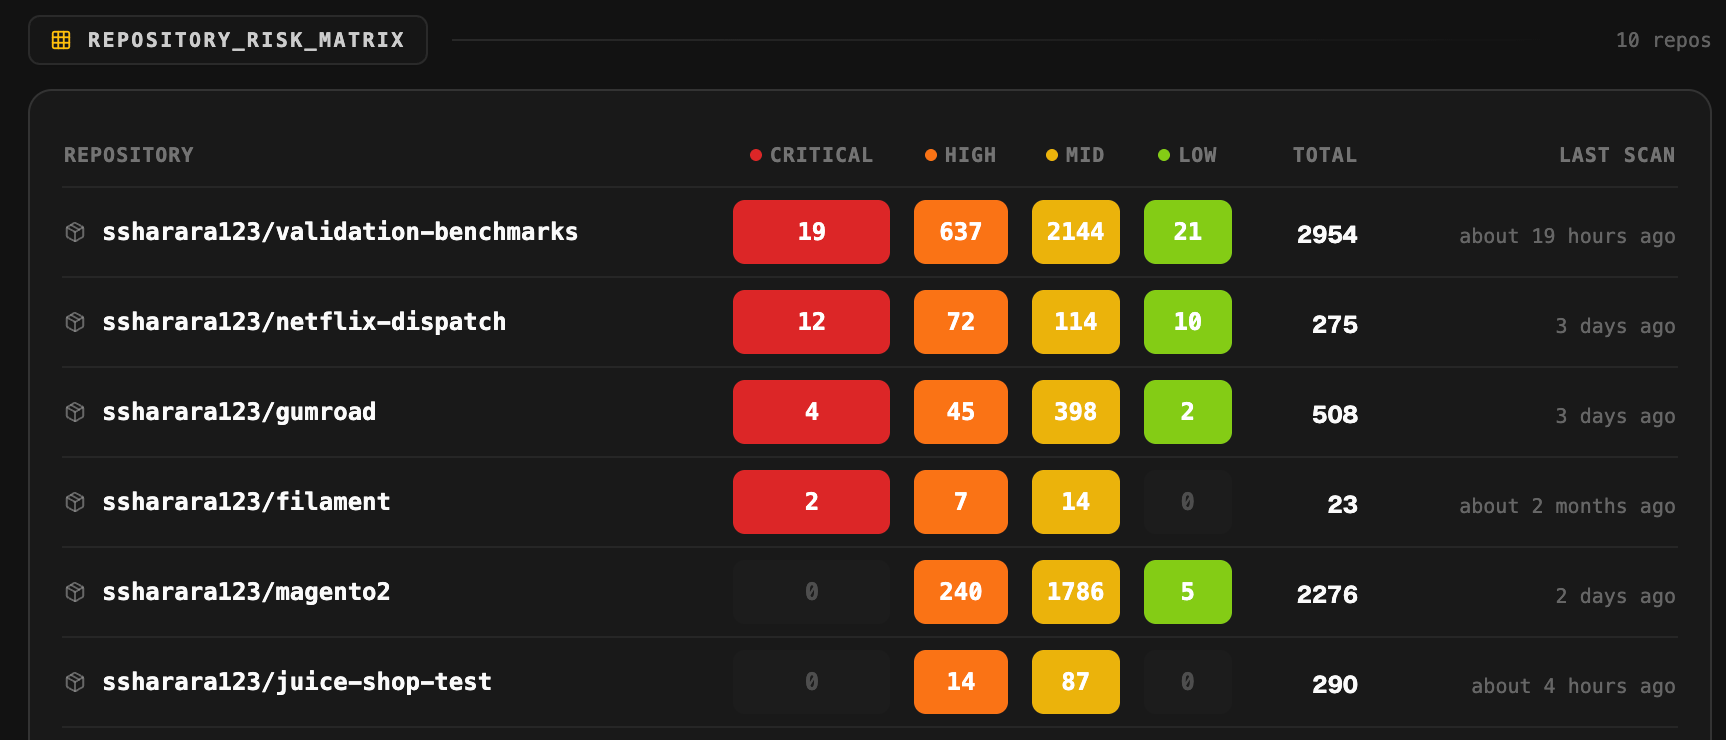
- Repository name
- Finding counts by severity - Critical, High, Mid, and Low displayed as color-coded badges
- Total findings
- Last scan time