Documentation Index
Fetch the complete documentation index at: https://docs.krait.io/llms.txt
Use this file to discover all available pages before exploring further.
The Tickets Dashboard
The Tickets Dashboard provides a unified, real-time view of all tickets generated within your Krait workspace-whether created through Jira or Linear. This dashboard enables security teams, engineering teams, and cross-functional stakeholders to track remediation progress with clarity and precision. This section explains the layout, features, and user interactions available within the dashboard.Overview
Each row in the dashboard represents a single ticket enriched with contextual metadata. The interface is designed for clarity and efficient scanning, making it easy to assess remediation status at a glance.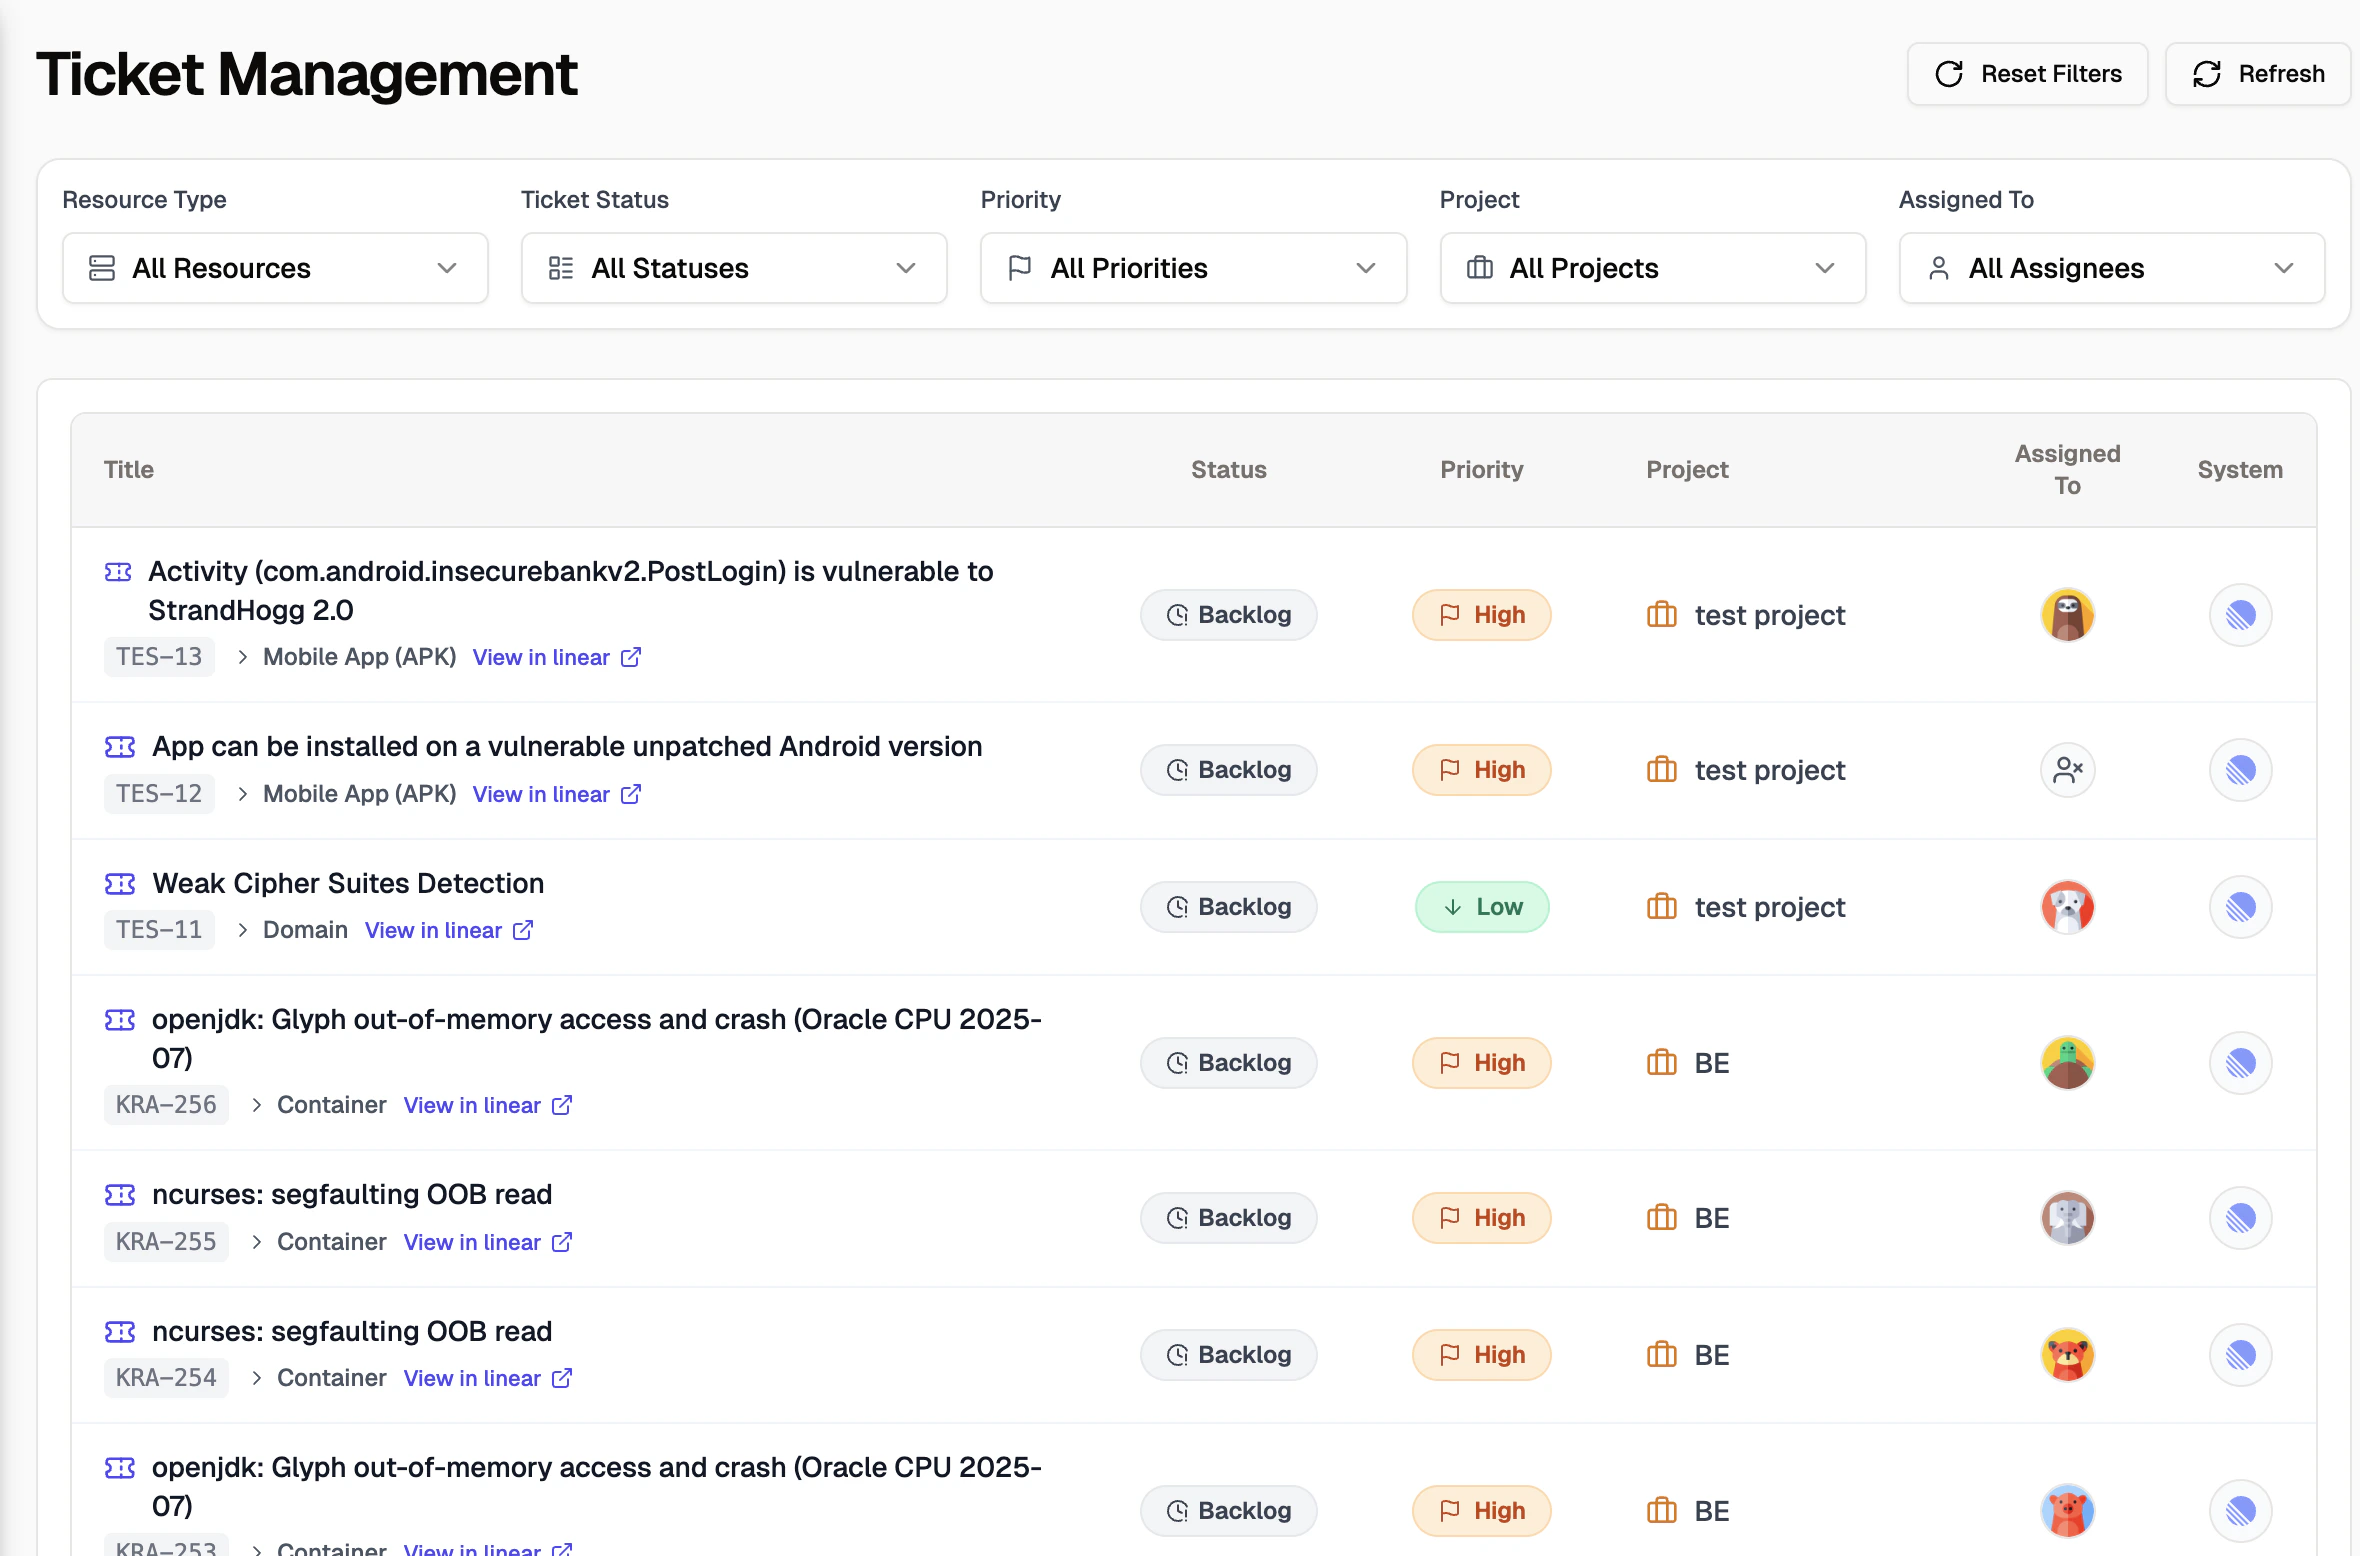
Key Columns Displayed
- Title & Ticket Key
Shows the issue title along with the ticket identifier (e.g., TES-13, KRA-256). Each entry includes a link to open the issue directly in Jira or Linear. - Resource Context
Indicates where the vulnerability originated-Repository, Container, Cloud, Mobile App (APK), DNS, or API Inventory-allowing engineers to immediately understand scope and impact. - Status
Displays the current workflow stage (Backlog, Todo, In Progress, Done, etc.). Status is continuously synced from your ticketing platform to keep Krait aligned with engineering activity. - Priority
A color-coded badge (Critical, High, Medium, Low) that helps teams quickly prioritize remediation tasks. - Project
Shows the associated Jira or Linear project/team where the issue is tracked. - Assigned To
Displays the engineer currently responsible for the remediation, with avatars for quick visual identification. - System
Identifies the originating ticketing platform (Jira or Linear) - through recognizable platform icons.
Filtering and Navigation
The dashboard includes an intuitive filtering bar designed to help teams instantly surface the tickets most relevant to their role or workflow.Available Filters
- Resource Type - Filter tickets by source (Repository, Container, Cloud, etc.).
- Ticket Status - View tickets by workflow state (e.g., In Progress, Done).
- Priority - Narrow the list to urgent issues or lower-priority items.
- Project - Filter by specific Jira or Linear projects.
- Assigned To - Identify tickets owned by specific engineers.
Utility Actions
- Reset Filters - Restores the dashboard to its default, unfiltered state.
- Refresh - Fetches the latest updates from Jira or Linear to ensure all ticket statuses, assignments, and metadata reflect the most recent activity.