Overview
Krait maintains two separate history logs: one for scans and one for user actions. Together they give security teams, workspace admins, and engineering leads full visibility into what is happening across the workspace at all times.Scan History
The Scan History page logs every scan that has been run across all connected assets. You can see what was scanned, what type of scan ran, how long it took, and whether it succeeded.Filters
Use the filters at the top of the page to narrow down the list:- Scan Status - filter by Completed, Failed, or In Progress
- Asset Type - filter by API or Repository
- Start Date and End Date - view scans within a specific time window
What the Table Shows
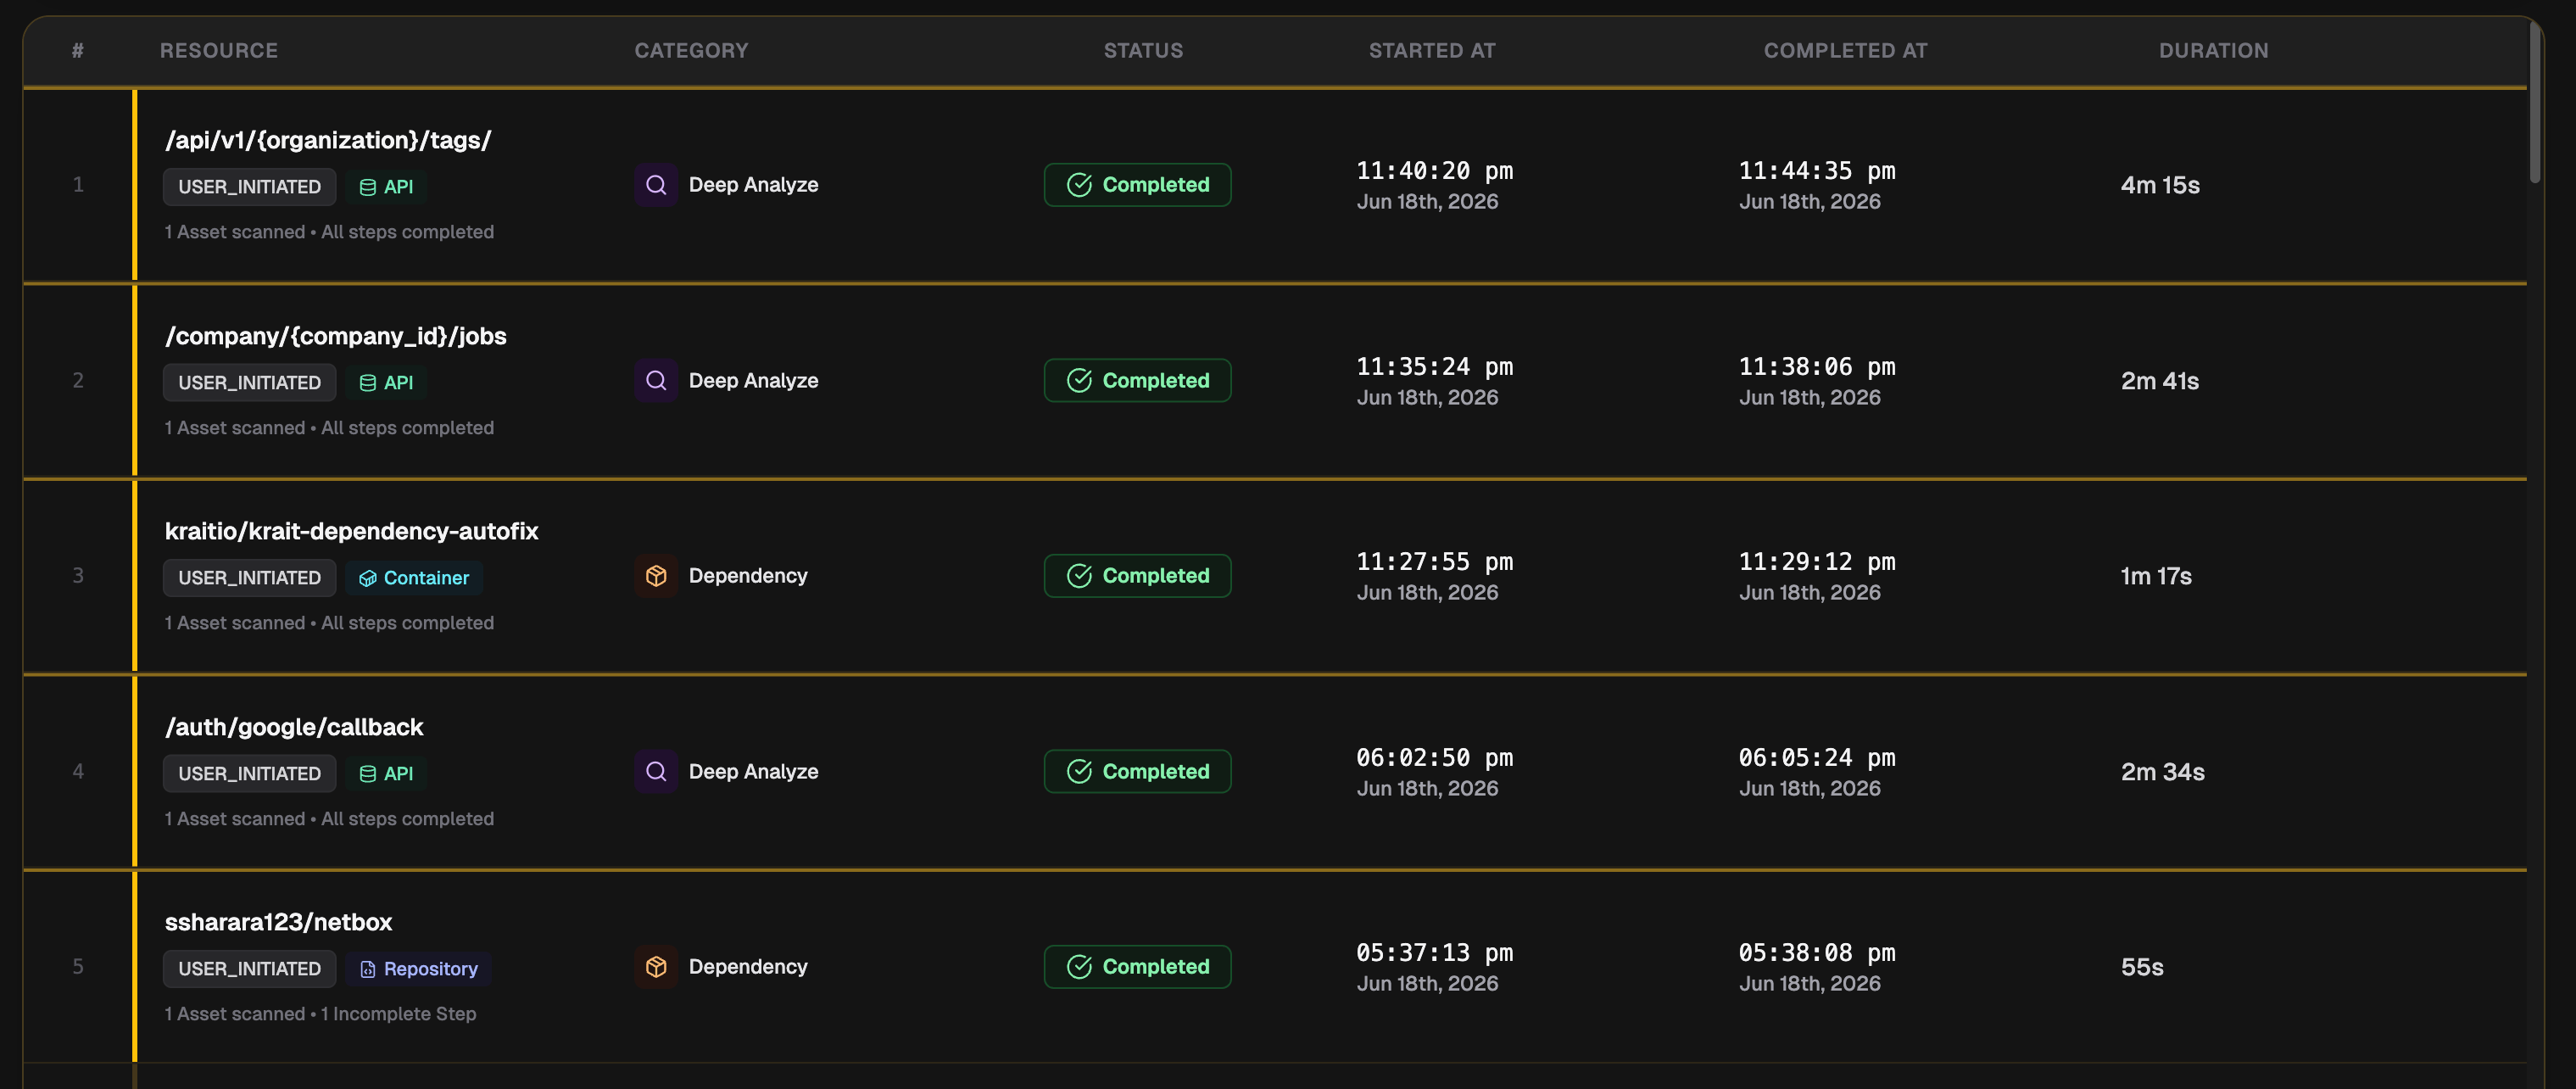
Each row in the Scan History table represents a single scan job and includes:- Resource - the asset that was scanned, such as an API endpoint or a repository, along with whether it was user-initiated and the asset type
- Category - the type of scan that ran. Possible categories include:
- Dependency - scans for vulnerable packages in the supply chain
- SAST - static analysis for code-level vulnerabilities
- Secret - detection of exposed credentials and secrets
- IaC - infrastructure-as-code misconfiguration checks
- RBAC - role-based access control analysis
- API Inventory - discovery and mapping of API routes
- Deep Analyze - AI-powered deep scan of API endpoints
- Status - Completed or Failed. A Failed status indicates one or more scan steps did not complete successfully
- Started At - the timestamp when the scan began
- Completed At - the timestamp when the scan finished
- Duration - total time taken for the scan to complete
Activity History
The Activity History page logs every action taken by workspace members. This makes it possible to trace who did what and when, across every resource in the workspace.Filters
- Action Modules - filter by the type of feature that triggered the action (e.g. autofix, repository management)
- Action Types - filter by the kind of action taken, such as create or delete
- Action Taker - filter by a specific workspace member
What the Table Shows
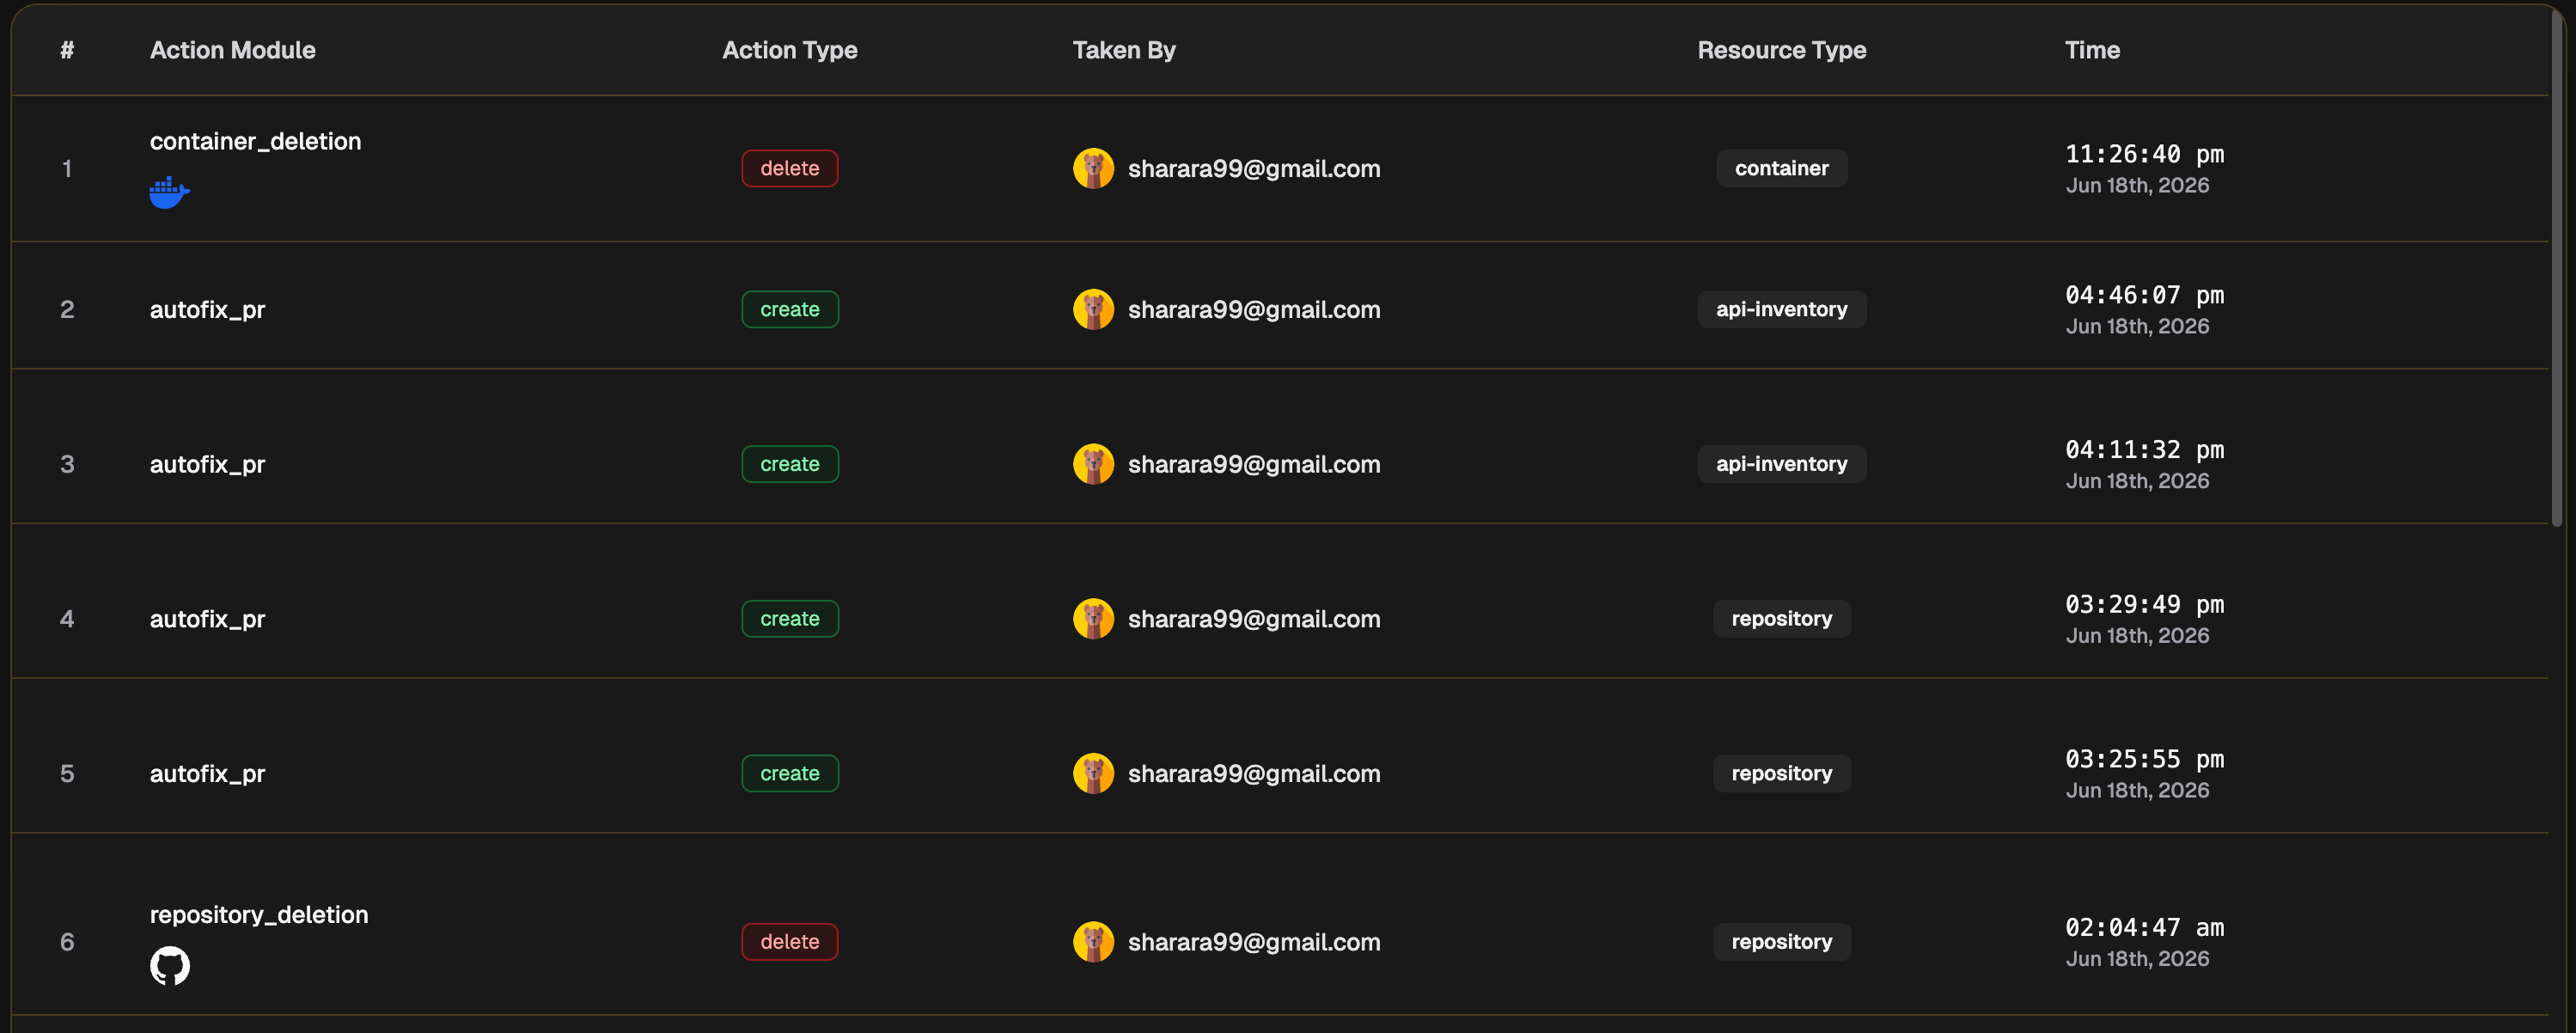
Each row represents a single user action and includes:- Action Module - the feature or system where the action originated, such as
autofix_prorrepository_deletion - Action Type - what was done, such as
createordelete - Taken By - the workspace member who performed the action, shown with their avatar and email
- Resource Type - the type of asset the action affected, such as
api-inventoryorrepository - Time - the exact timestamp of the action